

Key Insights:
- Bitcoin defies bears, surges to $27k amidst renewed hope.
- Bullish momentum propels Bitcoin’s recovery, and market cap rises.
- BTC shows signs of consolidation, the potential for further price rise.
In a dramatic twist, Bitcoin (BTC) fought off bearish pressure to make an impressive recovery, defying market expectations. After plummeting to an intraday low of $26,574.60, the bears seemed to have the upper hand. However, determined bulls stepped in, establishing crucial support that propelled the cryptocurrency to a remarkable 24-hour high of $27,203.32.
Amidst this exhilarating rally, bullish dominance remained firmly in control, resulting in a notable 0.52% surge to $27,055.16 at press time. This resurgence brought renewed hope to cryptocurrency enthusiasts, with Bitcoin’s market capitalization witnessing a solid 0.53% increase to reach an impressive $524,652,860,028. Simultaneously, the 24-hour trading volume skyrocketed by 15.89% to a staggering $15,549,315,194.
CypherMindHQ.com Artificial Intelligence Crypto Trading System - Surpass the competition with this cutting-edge AI system! Utilize the prowess of innovative algorithms and amplify your crypto trading strategies with CypherMindHQ. Learn more today!
This surge in Bitcoin’s performance comes at a critical juncture, just ahead of the highly anticipated release of US unemployment and non-farm payroll data. If bullish momentum rides this hype and breaches the 24-hour high of $27,203.32, the next resistance level to watch out for is $28,000. However, if bearish pressure takes over and the price falls below the 24-hour low of $26,574.60, the next support level is $26,000.
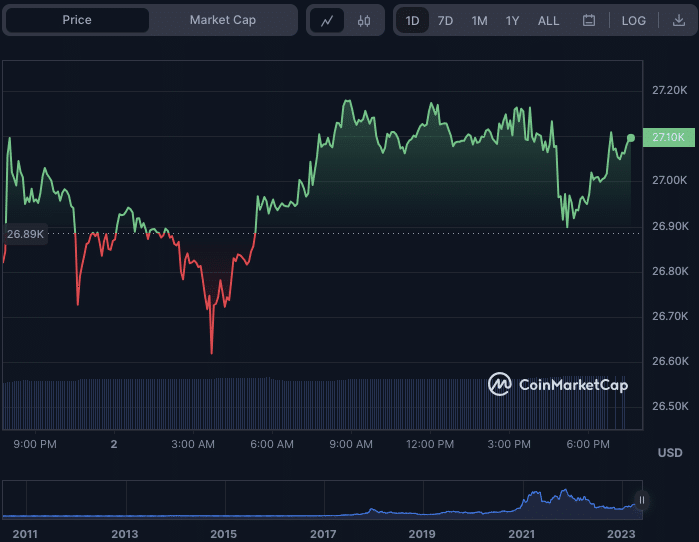
BTC/USD 24-hour price chart (source: CoinMarketCap)
BTC 2-Hour Technical Analysis
Keltner channel bands on the BTCUSD 2-hour price chart are moving linearly, indicating that the market is now undergoing consolidation. This is not always negative, as it might suggest that traders are taking a step back to examine the market and make informed judgments before making any large movements.
However, the price rise above the middle range shows that the market is gaining bullish momentum. This movement shows that the positive momentum has not yet peaked and that prices may rise in the near future.
The Relative Strength Index reading of 50.35 indicates that the market has more opportunity to rise before being overbought. This movement indicates that purchasing demand is still strong, and prices may continue to rise.
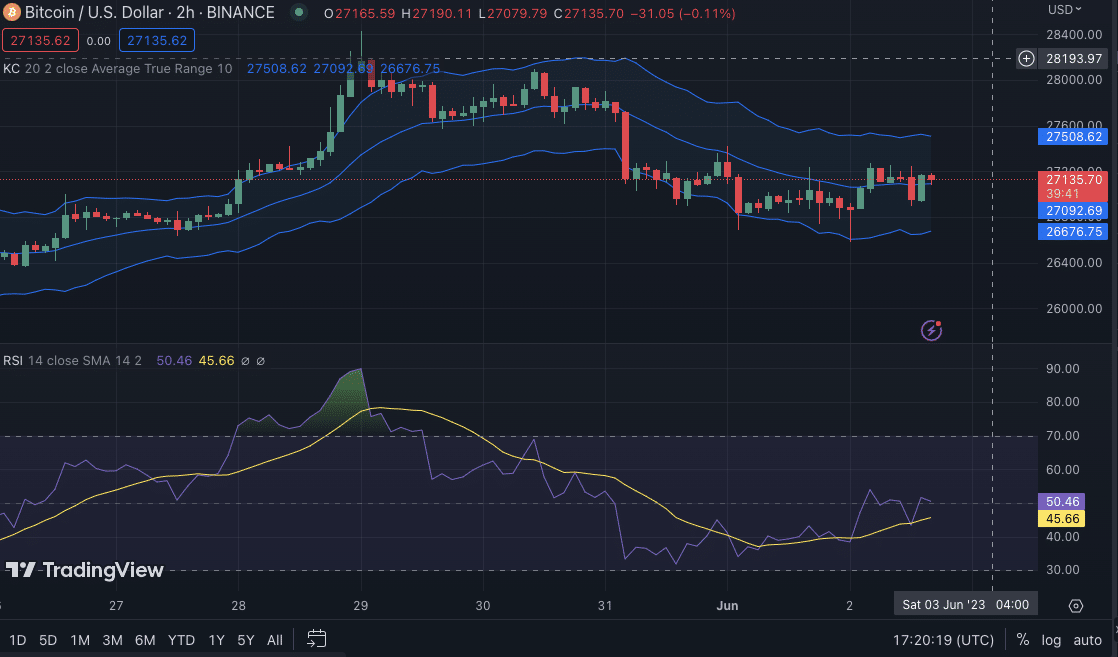
BTC/USD 2-hour price chart (source: TradingView)
BTC/USD 24-Hour Technical Analysis
CypherMindHQ.com Artificial Intelligence Crypto Trading System - Outpace the competition with this high-end AI system! Leverage the capabilities of progressive algorithms and enhance your crypto trading performance with CypherMindHQ. Learn more today!
The Chaikin Money Flow rating of 0.03 on the BTC 24-hour price chart indicates that the market is under modest purchasing pressure. This movement indicates that the positive momentum is expected to continue soon. Still, if the CMF rating falls below zero, it may signify a change toward selling pressure.
With the stochastic RSI reading 45.99 and going below its signal line, the price may have a little pullback before resuming its upward trajectory. This movement shows that investors are taking gains and selling their holdings, which might result in a short-term price fall.
The Money Flow Index rating of 38.04 implies that the bullish momentum has some space to go, but caution is advised as the market may be reaching a possible turning point. Consequently, traders must establish suitable stop-loss levels to safeguard their holdings.

BTC/USD 24-hour price chart (source: TradingView)
Conclusion
In conclusion, Bitcoin’s impressive recovery defies market expectations, as bullish momentum holds strong, paving the way for potential gains.


