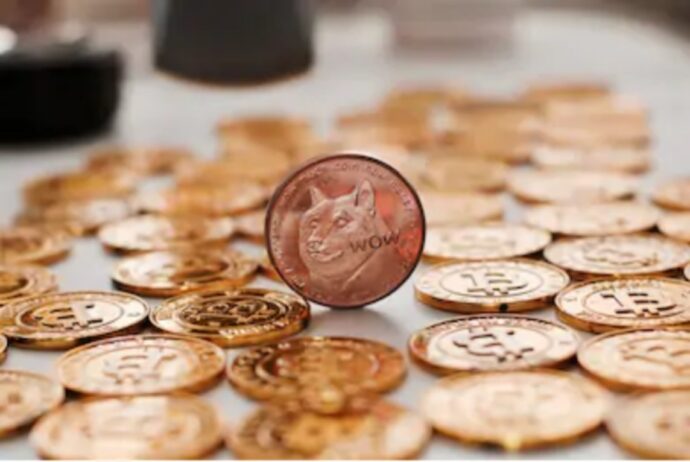
Uniswap and XRP started witnessing decent gains since June 27. XRP registered around 20% gains while Uniswap surged 18%. Dogecoin also saw its value appreciating, however, in a restricted range. As a result, the internet meme asset failed to break its resistance at $0.3.
Remember, the three alternative coins have been in the limelight recently due to various reasons. Uniswap hit the headlines after the recent collaboration by Fetch.ai that created Intelligent Automation for crypto. On the other hand, Jed McCaleb, Ripple’s ex-CTO, dumped XRP holdings worth about 240 million.
Dogecoin

CypherMindHQ.com Artificial Intelligence Crypto Trading System - Surpass the competition with this cutting-edge AI system! Utilize the prowess of innovative algorithms and amplify your crypto trading strategies with CypherMindHQ. Learn more today!
Dogecoin’s price chart has seen some decent recoveries since the June 21 plunge. The asset’s price remained above the support level at $0.238. However, the meme coin remains 65.85% lower from its all-time highest value with a 2.93 breakeven multiple. While writing this, Coinmarketcap ranks DOGE sixth. The crypto trades at $0.25 today.
DOGE had the Parabolic SAR showing white dots beneath the candles. That corresponds to the slight gains that the meme asset saw on June 29. The current condition in the Dogecoin market highlights a bullish run. Contrarily, the Signal lines and MACD saw a somewhat bearish crossover while writing this article. The coin might drop to test the $0.238 support in case of further losses.
Lastly, the ADX indicated a moderate directional market, standing at 27.6 at this writing. ADX beneath 25 would result in a massive trend that could push DOGE’s value higher.
XRP
XRP price chart indicates decent recoveries as the asset spiked by 3.23% in the past 24 hours and 5% high in the past seven days. As the alternative coin recovers from the lower lows it had recently, Bollinger Bands showed a divergence, indicating increased volatility and a stretched price range. For now, the altcoin trade at $0.678, ranking 7th on Coinmarketcap.
The XRP’s SMI (Squeeze Momentum Indicator) notes active white dots, accompanied by dark green candles, signaling incoming bearish sentiments. On its 4-hour price chart, XRP shows two red candles, indicating price slides.
The XRP’s RSI heads to the neutral territory after wavering in the overbought zone. RSI’s drop-stick shows increased selling pressure that drew the coin to the overbought area. However, while writing this, buyers dominated the XRP market.


