

Key Insights:
- Stellar (XLM) showcases robustness, bouncing from a low of $0.1254 to a bullish surge.
- Market interest in XLM is increasing, fueling its price ascension, but investors should proceed cautiously.
- Key indicators suggest a potential trend shift, signaling a need for investor vigilance.
Despite an initial stumble that saw the price of Stellar (XLM) take a nosedive, it managed to find stability thanks to the support at the day’s low of $0.1254. This price point attracted investors looking to capitalize on the lower market entry point.
Consequently, the price of Stellar started to bounce back, showcasing its robustness. The XLM price climbed to a 24-hour peak of $0.1435 before encountering resistance. At the moment of writing, the market was predominantly bullish, leading to an 8.99% surge to $0.1394.
CypherMindHQ.com Artificial Intelligence Crypto Trading System - Surpass the competition with this cutting-edge AI system! Utilize the prowess of innovative algorithms and amplify your crypto trading strategies with CypherMindHQ. Learn more today!
Should the bullish trend reach the $0.1435 mark, the price of Stellar could continue its upward trajectory and challenge higher resistance levels. The next significant resistance point to watch is approximately $0.1500. If the bullish trend fails to breach this point, the price of Stellar might either stabilize or experience a minor dip as traders start to cash in their profits.
During this bullish phase, XLM’s market cap and 24-hour trading volume increased 8.91% and 122.67%, respectively, reaching $3,769,919,702 and $294,832,210. This surge indicates the market’s growing interest and demand for Stellar. It implies that increasing investors are buying and trading XLM, which could further fuel its price ascension.
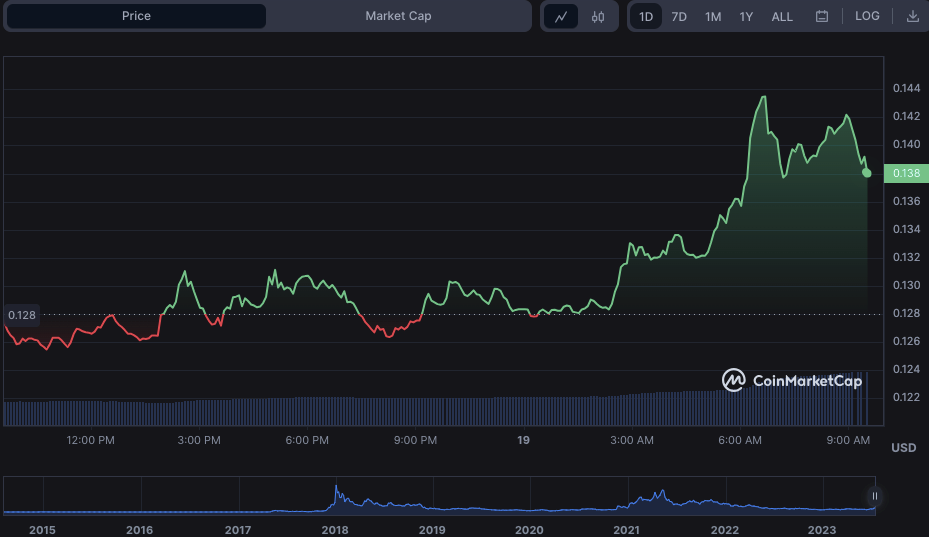
XLM/USD 24-hour price chart (source: CoinMarketCap)
The XLMUSD price chart demonstrates an upward trend in the Keltner Channel bands, with the top, center, and bottom bars hitting $0.14130898, $0.13482800, and $0.12148697, respectively. This trend suggests a surge in volatility within the XLMUSD market.
Nonetheless, the market’s price activity has ascended to the top band and is generating red candles, which could imply an overbought market condition. A drop in price activity beneath the central bar might hint at a momentum shift and a potential trend inversion.
The Money Flow Index (MFI) stands at 76.10 and is trending downward, suggesting that while the bulls maintain market dominance, the buying force could decline. If the MFI persists in its downward trajectory and dips below 50, it could signify a diminishing bullish trend and a transition toward a bearish market sentiment.
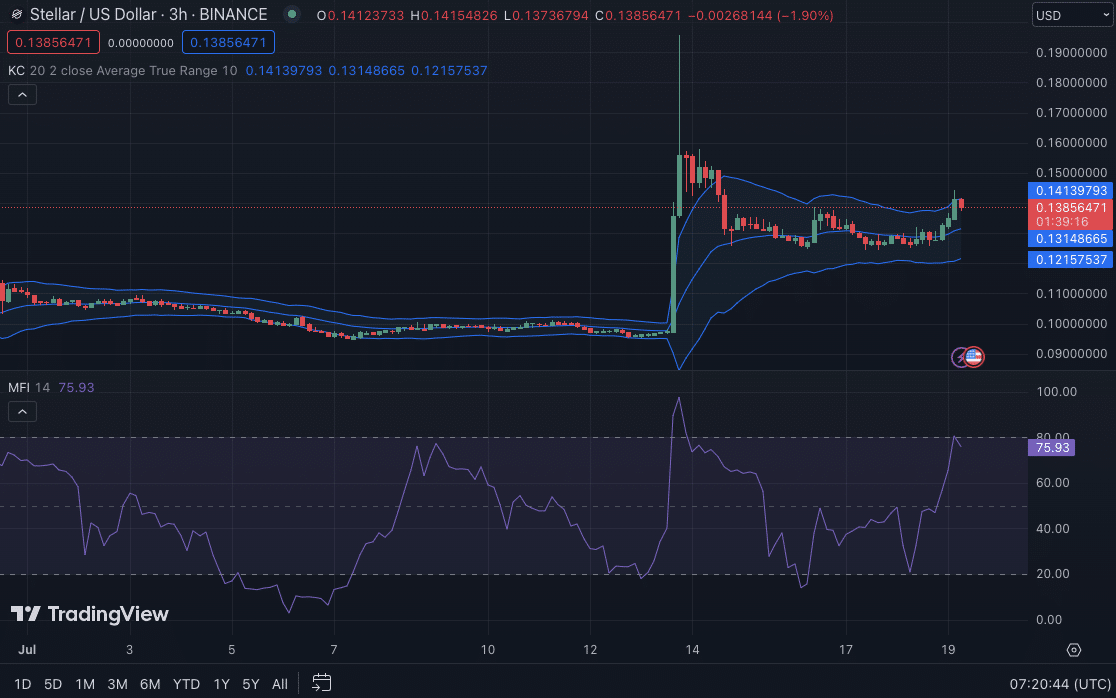
XLM/USD 3-hour price chart (source: TradingView)
In the XLMUSD 3-hour chart, the Aroon up displays a value of 92.86, while the Aroon down registers at 7.14%, suggesting a robust bullish trend in the market. Nonetheless, if the Aroon down value starts to climb and nears the Aroon up value, this could hint at a change in market sentiment from bullish to bearish and a potential weakening of the current bullish trend.
CypherMindHQ.com Artificial Intelligence Crypto Trading System - Outpace the competition with this high-end AI system! Leverage the capabilities of progressive algorithms and enhance your crypto trading performance with CypherMindHQ. Learn more today!
The MACD (blue) line continues to traverse above its signal line, with a current reading of 0.00206550, signifying that the bullish momentum is still in play. The histogram further supports this bullish sentiment by displaying positive values.
Investors should remain vigilant for any divergence or crossover between the MACD line and its signal line, as such movements could suggest a possible momentum reversal and a shift from bullish to bearish sentiment.
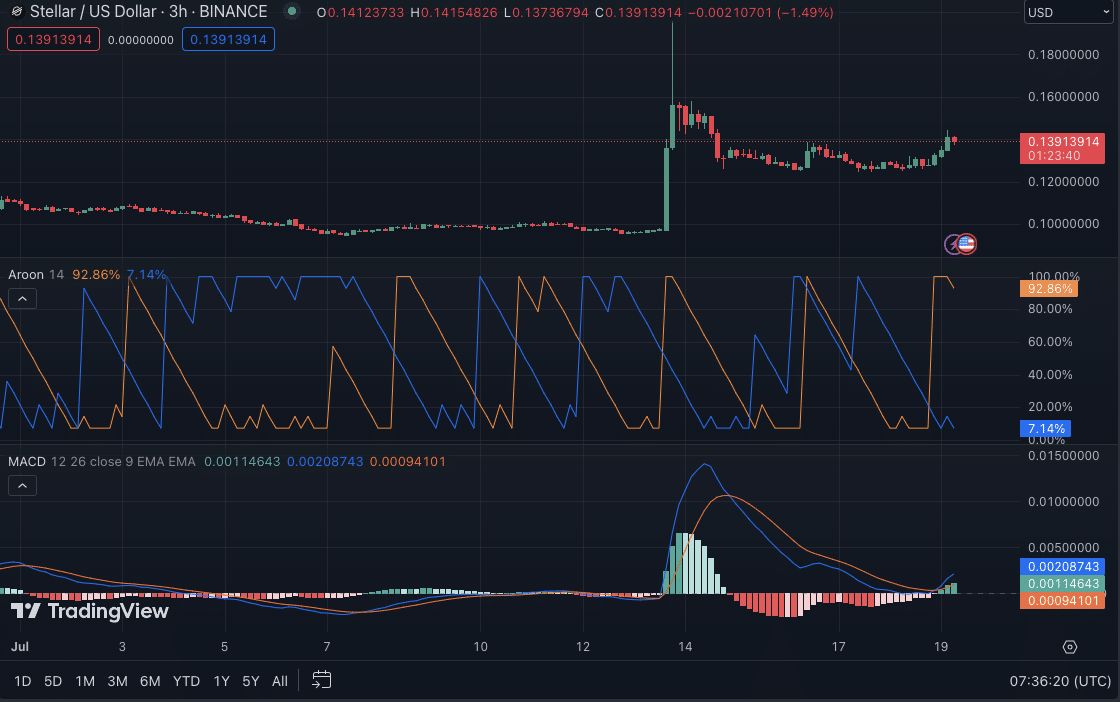
XLM/USD 3-hour price chart (source: TradingView)
Conclusion
To conclude, Stellar (XLM) has demonstrated robustness following a downturn as market interest and demand continue to rise. The upward trend persists, yet it’s essential to tread carefully since signs of an overextended market and diminishing buying pressure could indicate an impending shift in the opposite direction.


