
Key Insights:
- Solana (SOL) sees a 63% surge, trading at $32, levels last seen in Nov ’22, outpacing the top ten crypto assets in market cap growth.
- SOL’s trading volume soars, with over $1 billion trades in 24 hrs, as market indicators signal strong buying activity and market strength.
- Technical analysis shows SOL in a robust uptrend with potential overbought conditions, leading to the crypto market’s impressive rebound.
Solana (SOL) has carved out a triumphant narrative in the whirlwind world of cryptocurrencies, achieving remarkable gains in market value over the past month. With a 63% increase in the last month, the altcoin has climbed back to its trading levels from November 2022, signaling a significant milestone in its financial journey.
According to people familiar with the matter, as the community delves into the dynamics of this impressive rally, it is crucial to consider the broader crypto market’s performance, SOL’s burgeoning demand, and the critical momentum indicators that shed light on this upward trajectory.
The Broader Crypto Market’s Rebound
The cryptocurrency landscape has witnessed a palpable sense of optimism and growth, with leading assets like Bitcoin (BTC) and Ethereum (ETH) charting gains in the past 24 hours.
CypherMindHQ.com Artificial Intelligence Crypto Trading System - Surpass the competition with this cutting-edge AI system! Utilize the prowess of innovative algorithms and amplify your crypto trading strategies with CypherMindHQ. Learn more today!
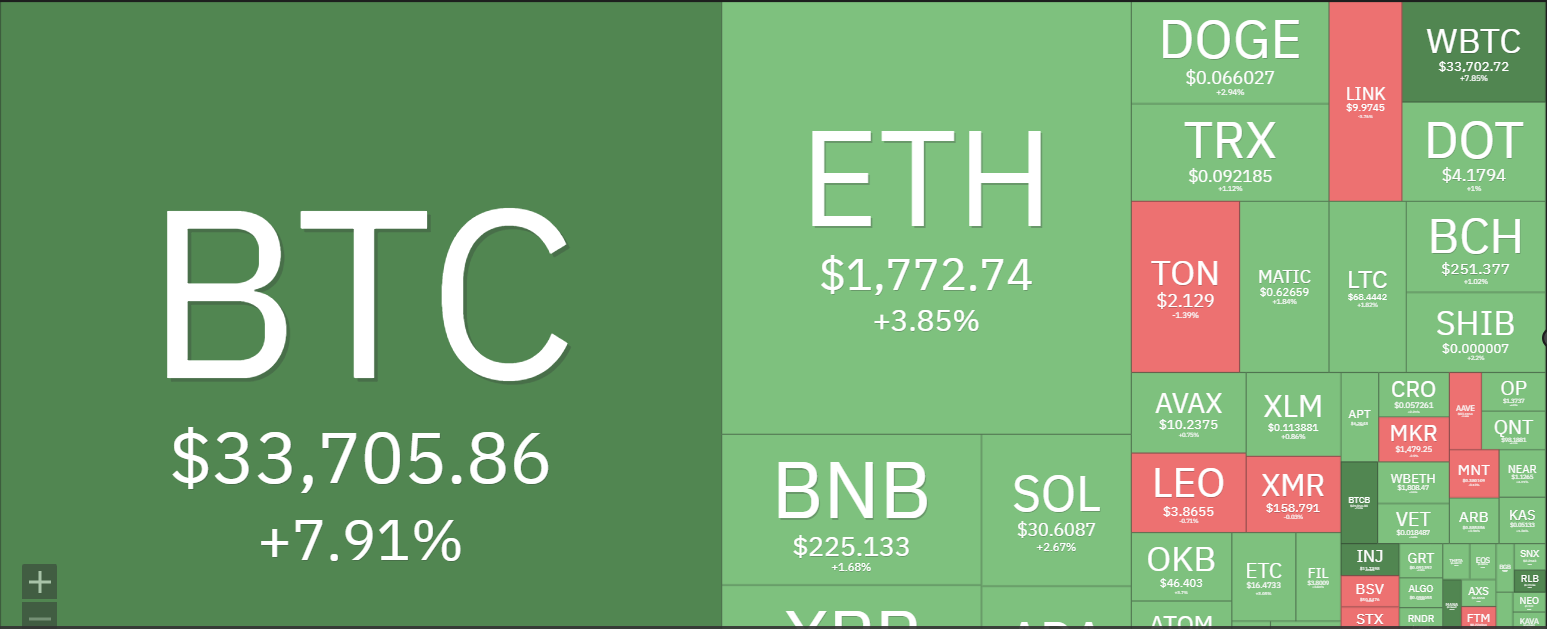
Source: Coin 360
Solana, however, stands out amongst its peers in the top ten crypto assets by market capitalization, boasting the most substantial growth and drawing attention from investors and market analysts alike.
Rising Demand and Trading Activity
The demand for SOL has reached new heights, as evidenced by its trading price of $30.66 per coin at press time, which harkens back to its value in November of the previous year. Market intelligence platforms such as Messari and CoinMarketCap offer data corroborating this bullish trend, highlighting a notable increase in trading activity surrounding SOL.
Since October 16th, the daily trading volume of SOL has surged by over 30%, culminating in trades worth over $1 billion in the last 24 hours, marking the highest daily trading volume since July.
Analyzing Momentum with Technical Indicators
A closer inspection of momentum indicators on SOL’s daily chart reveals a compelling story of accumulation outpacing distribution among spot traders. The Relative Strength Index (RSI) stands at an elevated 75.24, while the Money Flow Index (MFI) is at 74.31, suggesting that buying activity surpasses profit-taking, fueling the sustained rally in SOL’s price.
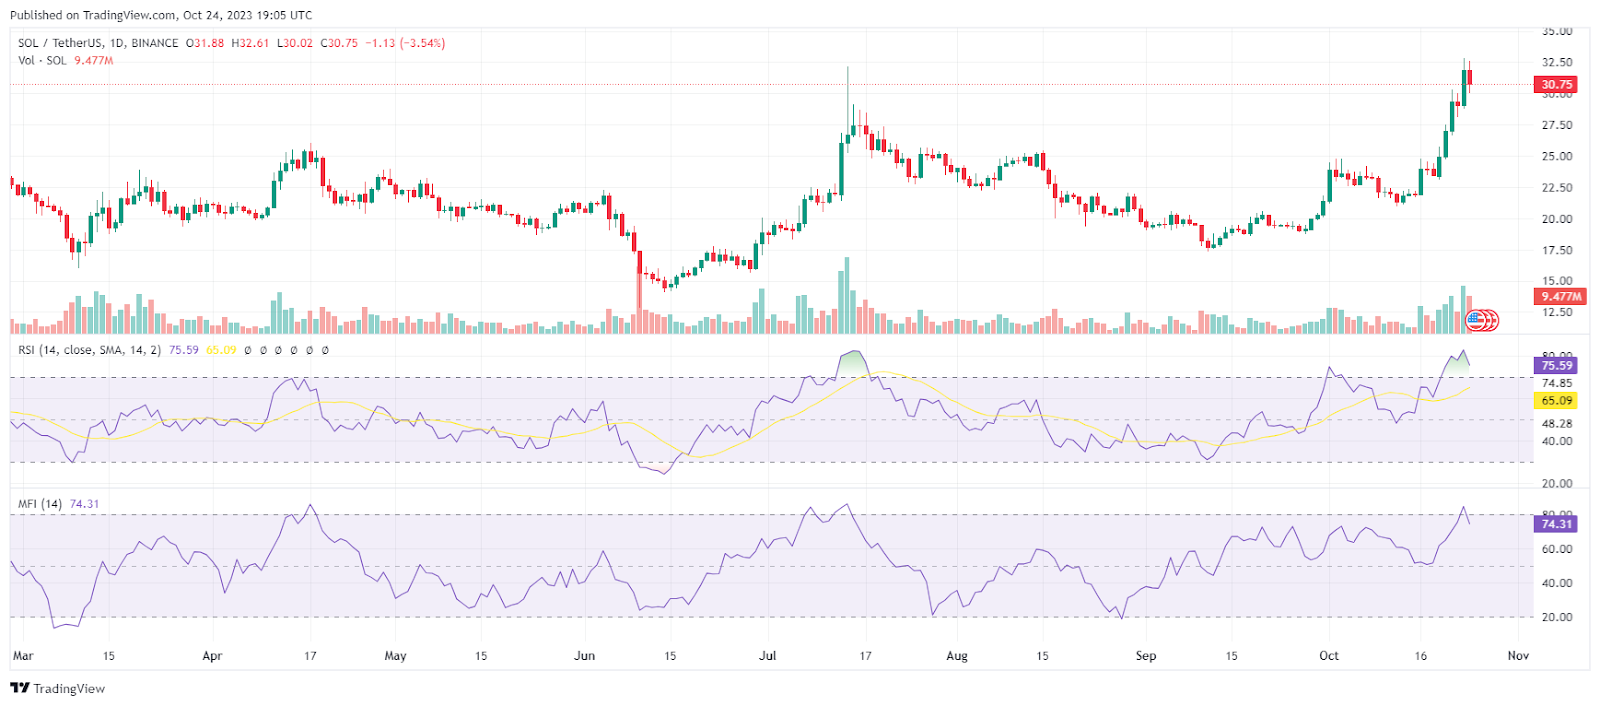
SOL/USD 1D price chart, Source: Trading View
Nevertheless, it is crucial to acknowledge that these high values imply that SOL might be overbought and could be on the cusp of a market correction.
Understanding Market Strength and Direction
The Chaikin Money Flow (CMF) provides insight into SOL’s buying and selling pressures at 0.08 at press time. A positive CMF value indicates market strength and signals an influx of liquidity, which is beneficial as it facilitates smoother trade executions for buyers and sellers, potentially mitigating price volatility.
CypherMindHQ.com Artificial Intelligence Crypto Trading System - Outpace the competition with this high-end AI system! Leverage the capabilities of progressive algorithms and enhance your crypto trading performance with CypherMindHQ. Learn more today!
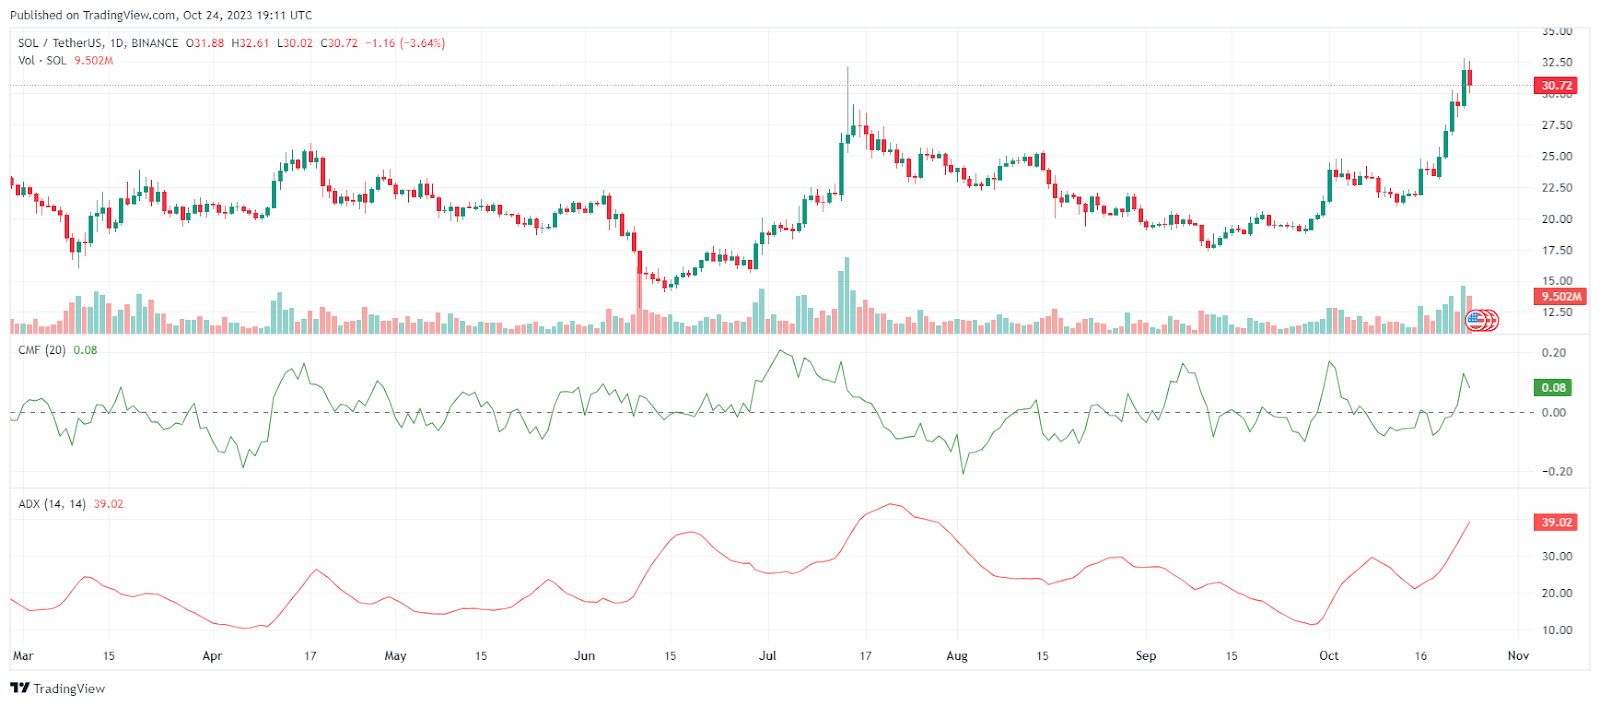
SOL/USD 1D price chart, Source: Trading View
Complementing this, the Average Directional Index (ADI) confirms the robust nature of the current uptrend, standing firm at 39.02 and underscoring the clear direction and bullish momentum behind SOL’s price movement. The Positive Directional Indicator further cements buyers’ dominance in the market, towering over the Negative Directional Indicator.
Solana’s impressive ascent to its pre-FTX trading levels is a testament to the resilience and potential of this altcoin in the volatile crypto market. Bolstered by a broader market rebound, soaring demand, and robust momentum indicators, SOL’s journey reflects a market ripe with opportunity and investor confidence. As the community continues to monitor its performance, the strength and directionality of this trend serve as critical indicators of Solana’s market positioning and future potential.


