

Key Insights:
- MATIC’s current market dynamics reflect a decline, with bears seizing control and causing a price drop.
- Technical indicators signal potential buying opportunities, hinting at price surges in the Polygon market.
- Cautious investors closely monitor MATIC’s market, waiting for signs of recovery before making substantial investments.
The Polygon market (MATIC) is brimming with optimism, as indicated by the TD sequential signaling a buying opportunity on MATIC’s 3-day chart, potentially propelling it to reach $0.94 or even $1.05. Nonetheless, within the last 24 hours, the market dynamics shifted as bears seized control, causing the price to plummet from an intraday high of $0.8712 to an intraday low of $0.8463.
As the bearish momentum persisted, the value experienced a decline of 2.68% to reach $0.8471 at the current time.
CypherMindHQ.com Artificial Intelligence Crypto Trading System - Surpass the competition with this cutting-edge AI system! Utilize the prowess of innovative algorithms and amplify your crypto trading strategies with CypherMindHQ. Learn more today!
The decline in MATIC’s market capitalization amounted to a 1.99% decrease, resulting in a valuation of $7,923,852,331. Furthermore, the 24-hour trading volume experienced a significant drop of 10.78%, settling at $293,382,782, which can be attributed to the prevailing recession. The decrease can be attributed to investors’ apprehension and careful observation of the MATIC market, as they refrain from making substantial investments until signs of recovery emerge.
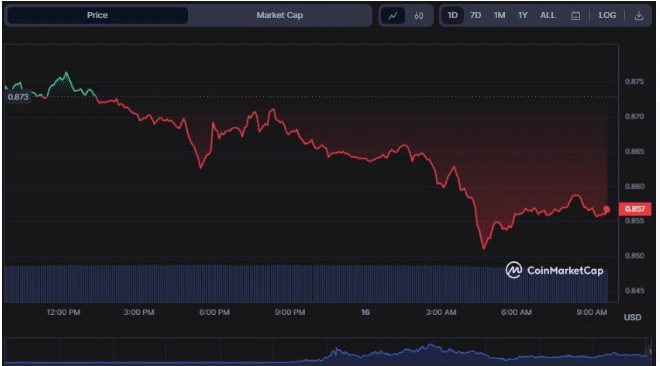
MATIC/USD 24-hour price chart (Source: CoinMarketCap)
On the price chart for MATIC, the upper and lower band values of the Kelter Channels (KC) are 0.876 and 0.846, respectively. The bands move linearly, reflecting a narrow range of price movement due to decreased volatility. If the price movement breaks through the bottom line, the negative trend will likely continue, and opportunities to take profits or sell short will present themselves.
On the price chart for the MATIC market’s 2-hour time frame, the Commodity Channel Index (CCI), which has a value of -78.02 and has its line pointing south, is now in a bearish position. This trend signals that the market is now subjected to significant selling pressure and that a price reversal will most likely occur soon.
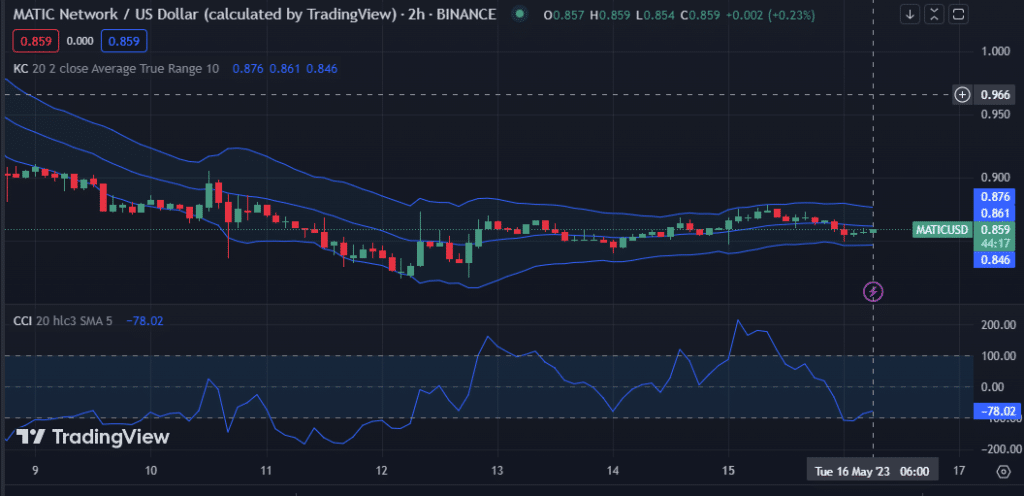
MATIC/USD 2-hour price chart (Source: TradingView)
The Chande Momentum Oscillator (ChandeMO) for the MATIC market’s 2-hour price chart now displays a value of -40.00, reflecting the solid negative hand currently in play. Conversely, this action suggests that MATIC might be preparing for a short-term bounce because it is now oversold.
On the two-hour price chart for the MATIC market, the Elder Force Index (EFI) is displaying a value of -130k, indicating that the market is experiencing increased levels of selling pressure and may maintain its downward trend. This pattern demonstrates that the bulls need to exert more pressure to counteract the negative momentum that is now present in the market.

MATIC/USD 2-hour price chart (Source: TradingView)
CypherMindHQ.com Artificial Intelligence Crypto Trading System - Outpace the competition with this high-end AI system! Leverage the capabilities of progressive algorithms and enhance your crypto trading performance with CypherMindHQ. Learn more today!
Conclusion
While MATIC contends with downward market forces, prudent investors diligently observe its trading landscape. Nevertheless, various technical indicators allude to promising price upswings, instilling a sense of positivity within the Polygon market.


