

Key Insights:
- Ethereum (ETH) experienced a bearish start but rebounded and is testing resistance at $1,936.95.
- Rising MACD and MFI scores indicate positive momentum, but caution is advised due to Aroon and stochastic RSI indicators.
- Traders should consider risk management methods and watch for trend reversals as ETH’s price approaches $2,000.
In the last 24 hours, bears had the upper hand in the Ethereum (ETH) market, pushing prices down to a support level of $1,868.00. However, the bears’ dominance was short-lived as bullish momentum entered the market and tested resistance at $1,936.95.
Breaking this barrier level could send the ETH price to the next resistance level of $2,000. If negative momentum prevails, the support zone at $1,868.00 will be at risk, potentially leading to a slide to the next support level of $1,800.00.
CypherMindHQ.com Artificial Intelligence Crypto Trading System - Surpass the competition with this cutting-edge AI system! Utilize the prowess of innovative algorithms and amplify your crypto trading strategies with CypherMindHQ. Learn more today!
ETH’s value at the time of writing was $1,908.29, showing a 1.35% increase from the previous day’s closing price. This increase suggests a probable positive trend. During the recovery, the market capitalization of ETH also rose by 1.38% to $229,760,764,874, while the 24-hour trading volume decreased by 33.84% to $11,243,001,517.
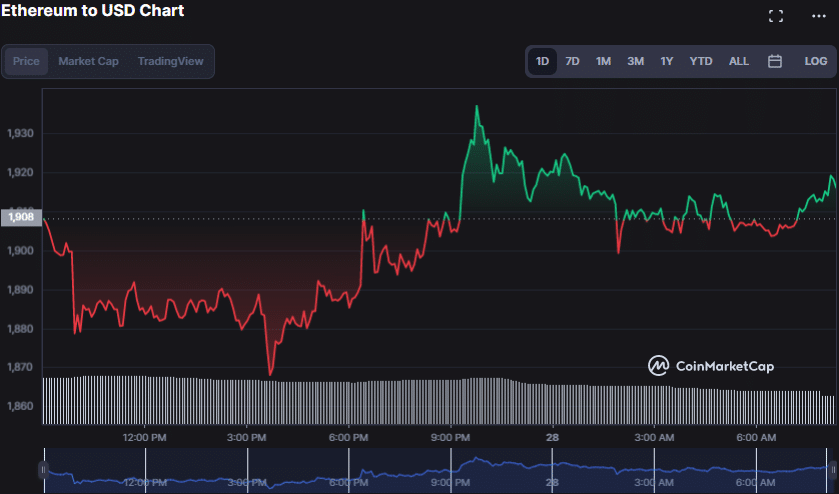
ETH/USD 24-hour price chart (source: CoinMarketCap)
According to the price chart for ETH/USD over a 4-hour time frame, the MACD line has moved higher than 9.22, and green bars are filling the histogram. These signs hint at a rise in bullish momentum for Ethereum, a positive development. The favourable trend would enhance traders’ confidence and may even draw more investors to the crypto market.
The Money Flow Index (MFI) score of 55.05 is additional confirmation of the upward momentum that Ethereum is now experiencing. This score is greater than the threshold of 50, indicating that there is now more demand for products on the market than supply, indicating that prices are likely to rise. As a consequence, the current trend is projected to continue, which can result in more gains for ETH.
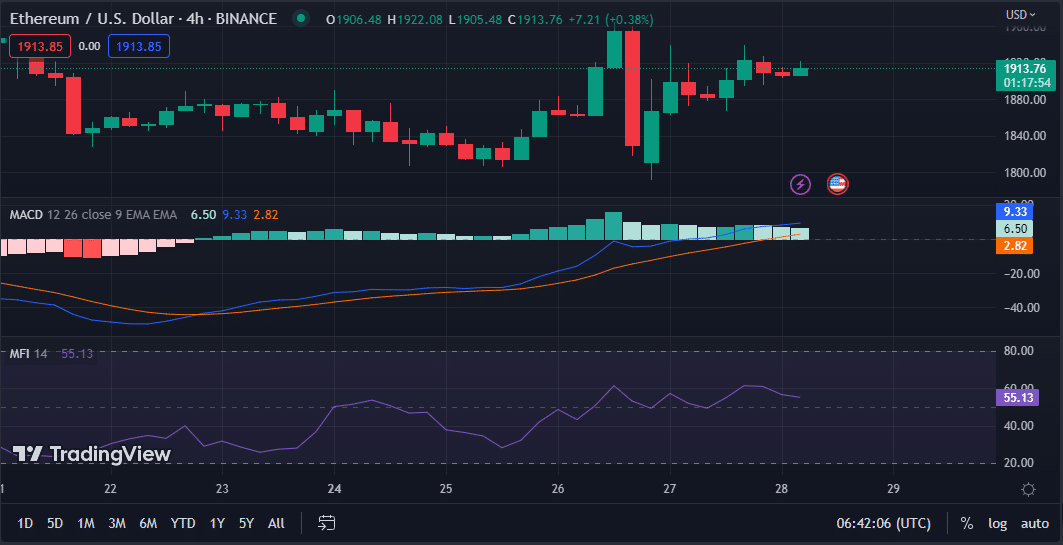
ETH/USD chart (source: TradingView)
The orange Aroon up (28.57) is eclipsed by the blue Aroon down (42.86), suggesting an oncoming trend reversal as the upward momentum fades and the downward momentum intensifies. This is shown by the fact that the blue Aroon down is higher than the orange Aroon up. This underscores traders’ need to consider tactics for either profit-taking or risk management to safeguard their capital.
The stochastic RSI now has a value of 47.43 and is moving in the direction of being below its signal line. This indicates that bullish momentum is waning, which points to the possibility of a change in market attitude. When taken along with the fact that the Aroon indicator has shown a reversion to a downward trend, this may suggest that now is an appropriate time for traders to open short positions.
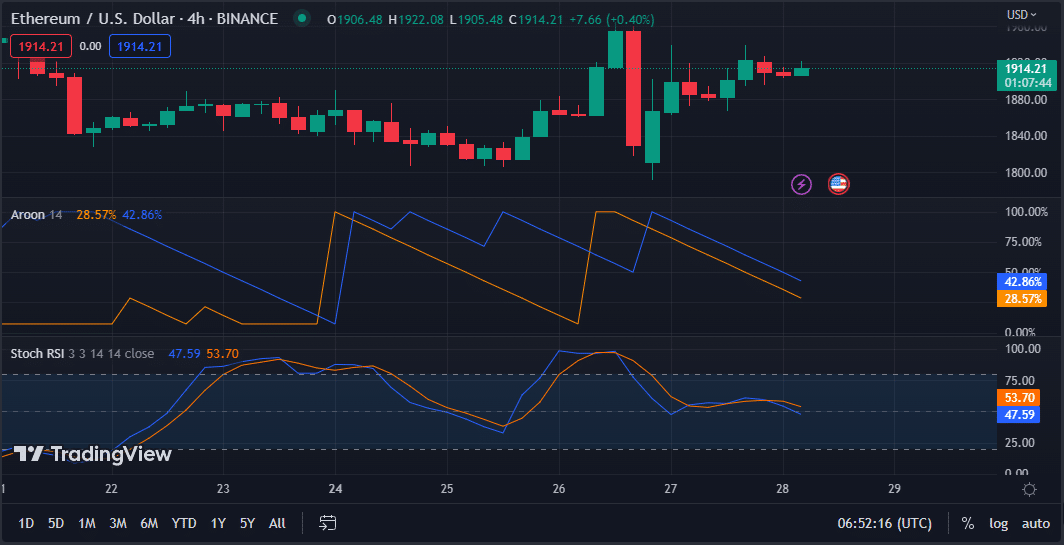
ETH/USD chart (source: TradingView)
CypherMindHQ.com Artificial Intelligence Crypto Trading System - Outpace the competition with this high-end AI system! Leverage the capabilities of progressive algorithms and enhance your crypto trading performance with CypherMindHQ. Learn more today!
Conclusion
As bullish momentum builds, ETH’s price looks poised to break through resistance and reach $2,000. However, traders should be cautious of possible trend reversals.


