

Key Insights:
- LINK’s fierce $7 resistance battle highlights a bearish market.
- Negative divergence and a falling RSI foretell LINK’s downward trend.
- MACD and CMF indicators favor bears, advising traders’ caution.
Despite a recent rally, the second quarter of 2023 has been characterized by continuous struggles for Chainlink (LINK). Nevertheless, the digital asset put on an impressive display in July, soaring beyond the $7 mark on July 14th. According to CoinMarketCap data, this move resulted from a solid 10.17% price increase over seven days.
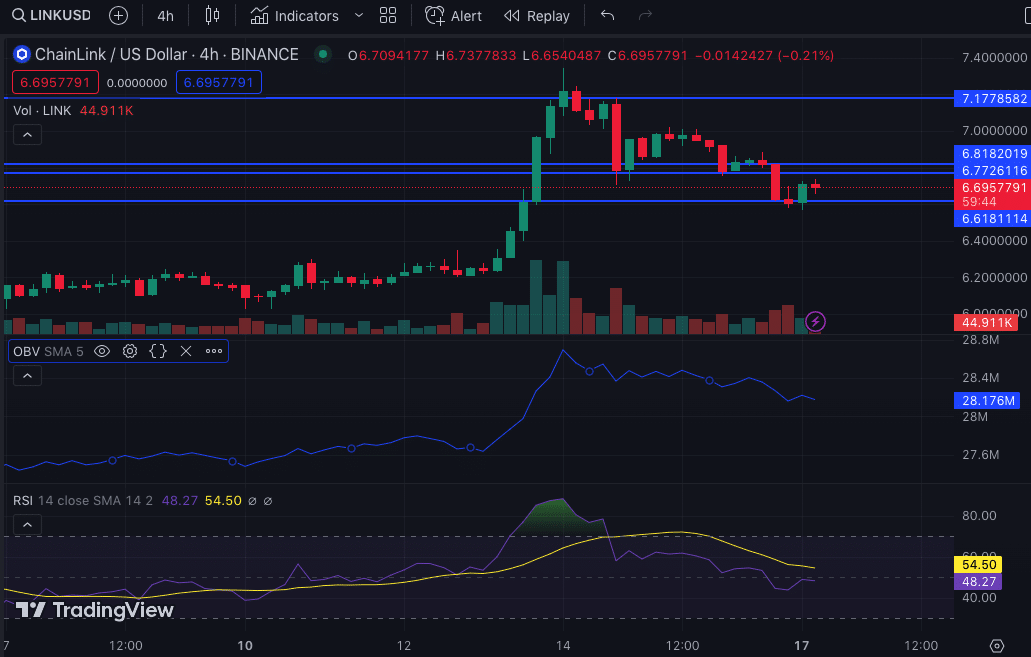
However, LINK’s bullish streak didn’t last long. The digital token’s price took a hit, retracting to $6.68. The sharp rejection at $7.17 marked a turning point in the LINK/USD trading session. Despite buyers’ relentless efforts, they fell short, unable to maintain a sustainable price recovery.
CypherMindHQ.com Artificial Intelligence Crypto Trading System - Surpass the competition with this cutting-edge AI system! Utilize the prowess of innovative algorithms and amplify your crypto trading strategies with CypherMindHQ. Learn more today!
Demand vs. Supply: LINK’s Ongoing Struggle
Interestingly, the demand for LINK resurfaced at $6.77 on July 16th. Unfortunately, it was still insufficient to overpower the overwhelming sell orders. Consequently, the digital asset fell significantly, closing at $6.66. The On-Balance-Volume (OBV) metric also signaled that LINK was entering a distribution phase, pointing to a possible bearish reversal.
Significantly, a negative divergence began on July 14th, stalling LINK’s price. This divergence, characterized by the failure of the OBV to hit a new high concurrent with LINK’s price peak, suggests a downward breakout could be imminent unless balanced by accumulation.
Technical Indicators Predict LINK’s Downward Trajectory
Moreover, the Relative Strength Index (RSI) is trending downwards. Currently, at 48.13, the RSI indicates a reduction in buying strength. If this trend persists, LINK’s price may drop below $6.50.
Additionally, the Moving Average Convergence Divergence (MACD) shows a negative value of -0.055 at press time. Typically, a negative MACD signals that the 12-day EMA is below the 26-day EMA, suggesting that the downward trend is gaining momentum. Hence, traders might be advised to refrain from buying at $6.68.
Furthermore, the orange dynamic line on the MACD chart has moved above the blue one, indicating that sellers are gaining the upper hand.
The Chaikin Money Flow (CMF), another crucial technical indicator, also points towards a potentially bearish scenario. The CMF stands at -0.17, suggesting an imbalance favoring the bears.
CypherMindHQ.com Artificial Intelligence Crypto Trading System - Outpace the competition with this high-end AI system! Leverage the capabilities of progressive algorithms and enhance your crypto trading performance with CypherMindHQ. Learn more today!

The CMF must diverge with a higher low to confirm a buy signal. This must be followed by the price falling into an oversold region. However, if this doesn’t happen, LINK’s price might continue to fall.
Conclusion
Chainlink (LINK) finds itself at a pivotal juncture. Its struggle to breach and hold the $7 mark indicates the bearish pressures it currently faces. With several technical indicators suggesting a continuation of the downtrend, LINK’s journey to recovery may be an uphill battle.


