

Key Insights:
- Despite market instability, Bitcoin’s price decline and oversold indicators indicate a potential rebound.
- Concerns rise as BTC tests $26k, increasing the likelihood of a drop to the $20k-$25k range.
- Despite the slight decline, many investors maintain optimism about BTC’s long-term prospects.
Concerns regarding a potential drop in price to the range of $20k to $25k have surged as Bitcoin (BTC) once again tests the $26k threshold. The prevalence of BTC in social circles has experienced a significant surge, indicating a prevailing sense of apprehension. These fear signals heighten the probability of an imminent recovery as investors actively seek opportunities to reinvest at more affordable rates. Nevertheless, concerns persist regarding the durability of the ongoing market correction.
In the last 24 hours, the Bitcoin market experienced a significant shift as bears seized control, leading to a price decline. Despite a temporary intraday high of $27,466.53, the market succumbed to downward pressure, resulting in an intraday low of $26,415.10. At the time of writing, Bitcoin’s price stood at $26,841.35, indicating a 1.90% decrease from its previous closing. This persistent downward trend has affected the overall market sentiment.
CypherMindHQ.com Artificial Intelligence Crypto Trading System - Surpass the competition with this cutting-edge AI system! Utilize the prowess of innovative algorithms and amplify your crypto trading strategies with CypherMindHQ. Learn more today!
BTC’s total market value and trading volume over the past 24 hours witnessed a marginal decline of 1.16% and 0.32%, respectively, resulting in figures of $521,393,055,794 and $14,918,423,391. This slight downturn can be attributed to the inherent volatility and unpredictability in the overall market conditions. Despite this, numerous investors maintain a positive outlook on BTC’s future potential, emphasising its long-term prospects.
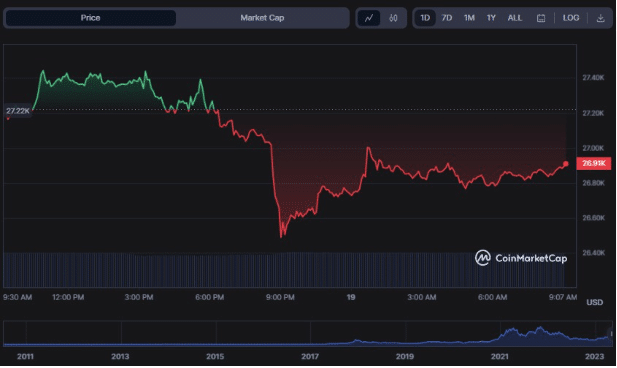
BTC/USD 24-hour price chart (Source: CoinMarketCap)
On the 4-hour BTC price chart, the Fisher Transform line with a value of -0.46 below the signal line suggests that the market is oversold and a possible buy signal is approaching. If the Fisher Transform Line can traverse the signal line, then the reversal will be evident.
The stochastic relative strength index for BTC/USD on a 4-hour time frame is now at 33.44, suggesting that the market is oversold and may shortly revert bullishly to the upside. This means that there is an opportunity for investors to buy low and sell high.
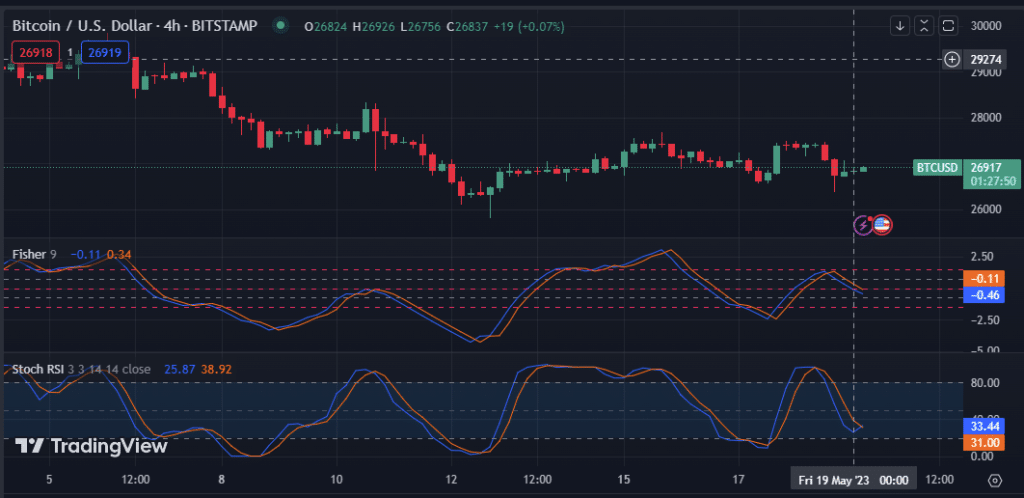
BTC/USD 4-hour price chart (Source: TradingView)
Because the RSI reading of 45.34 is below the signal line, indicating that BTC is oversold, selling pressure may persist for now. If the RSI is in the oversold range, traders may wait until it rises above its signal line before entering a long bet.
The Money Flow Index (MFI) now stands at 44.38 and points downward, suggesting increasing selling pressure, which lends credence to the negative momentum in BTC. If the MFI falls and then breaks below the oversold level, traders should be cautious when assessing long bets. This shift might be the beginning of a far steeper downward trend.
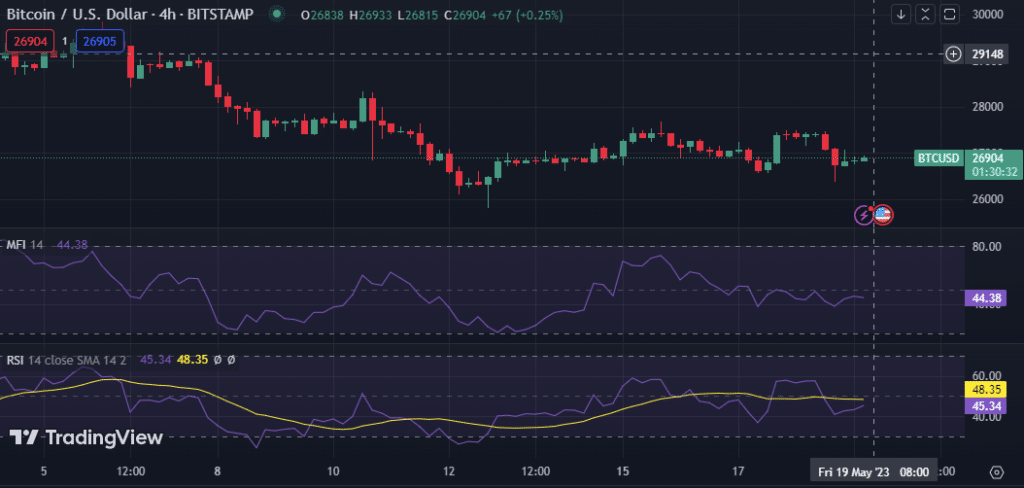
BTC/USD 4-hour price chart (Source: TradingView)
CypherMindHQ.com Artificial Intelligence Crypto Trading System - Outpace the competition with this high-end AI system! Leverage the capabilities of progressive algorithms and enhance your crypto trading performance with CypherMindHQ. Learn more today!
Conclusion
While Bitcoin is under selling pressure and negative momentum, oversold signs suggest a possible bounce. Market instability has caused traders to exercise extreme caution.


