

Key Insights:
- ARB/USD faced resistance at $1.35 and dropped to $1.30 in a bearish market sentiment.
- The widening Bollinger bands and growing transaction volume suggest a possible turnaround.
- Traders can now consider buying ARB/USD to profit from potentially favourable sentiment.
In the last 24 hours, the Arbitrum (ARB) market witnessed a solid bullish trend that pushed the prices until it faced resistance at the intra-day high of $1.35. However, the bullish momentum could not continue as the market faced resistance, and the bears took over, leading to a decline in ARB prices to a 24-hour low of $1.30. Currently, ARB is trading at $1.32, representing a 2.16% drop from the previous day’s closing price, indicating a bearish market sentiment.
Following a market correction, the total market capitalization of the asset experienced a decline of 2.21% and settled at $1,676,680,073. The 24-hour trading volume also decreased by 36.74% and reached $272,904,754.
CypherMindHQ.com Artificial Intelligence Crypto Trading System - Surpass the competition with this cutting-edge AI system! Utilize the prowess of innovative algorithms and amplify your crypto trading strategies with CypherMindHQ. Learn more today!
The difference between the selling and buying assets during the correction demonstrates the market’s high unpredictability. Investors instantly sell their assets and purchase them at lower prices to increase trade volume.
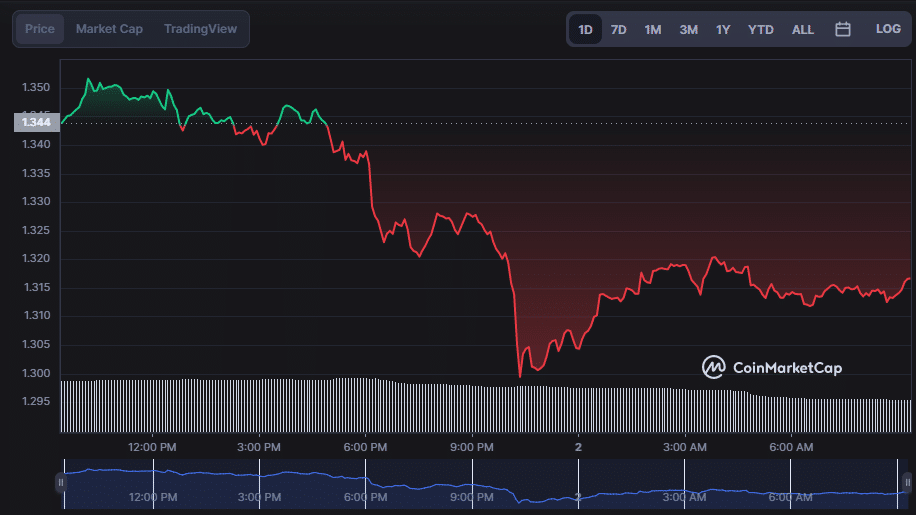
ARB/USD 24-hour price chart (source: CoinMarketCap)
On the 4-hour price chart for ARB/USD, the widening Bollinger bands and increasing transaction volume indicate that the momentum toward a bearish price movement is waning and that a reversal is likely shortly.
As price action approaches the Simple Moving Average line, a growing green enormous candlestick may indicate that bulls are gaining control and buyers are moving in. This may mean a shift in market sentiment toward an optimistic stance.
The MACD line is now located at -0.05, which indicates that the market is exhibiting a slender degree of negative momentum. Nevertheless, the appearance of a green candlestick and the possibility of a shift toward a more bullish mood implies that the current time may be an excellent time to think about buying into the market.
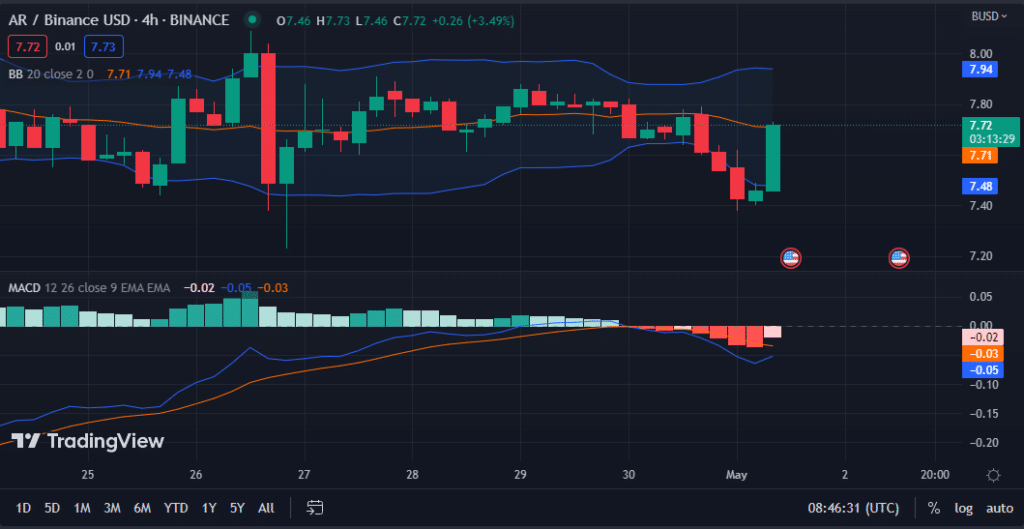
ARB/USD 4-hour chart (source: TradingView)
The 100-day MA (orange) reading of 8.16 movement above the 20-day MA (blue) reading of 7.71 on the ARB/USD 4-hour price chart suggests that the longer-term trend is more favourable than the short-term trend, which might signal that a possible bullish sentiment for ARB is on the horizon.
This action suggests that traders consider buying ARB/USD at present levels in order to profit from potentially favourable sentiment.
CypherMindHQ.com Artificial Intelligence Crypto Trading System - Outpace the competition with this high-end AI system! Leverage the capabilities of progressive algorithms and enhance your crypto trading performance with CypherMindHQ. Learn more today!
Price activity below both moving averages indicates that the bears are in command. However, the bear reign may end as ARB tests the 20-day moving average. This price action close to the 20-day moving average may encourage traders and investors to enter the market by purchasing the dip to benefit from future gains.
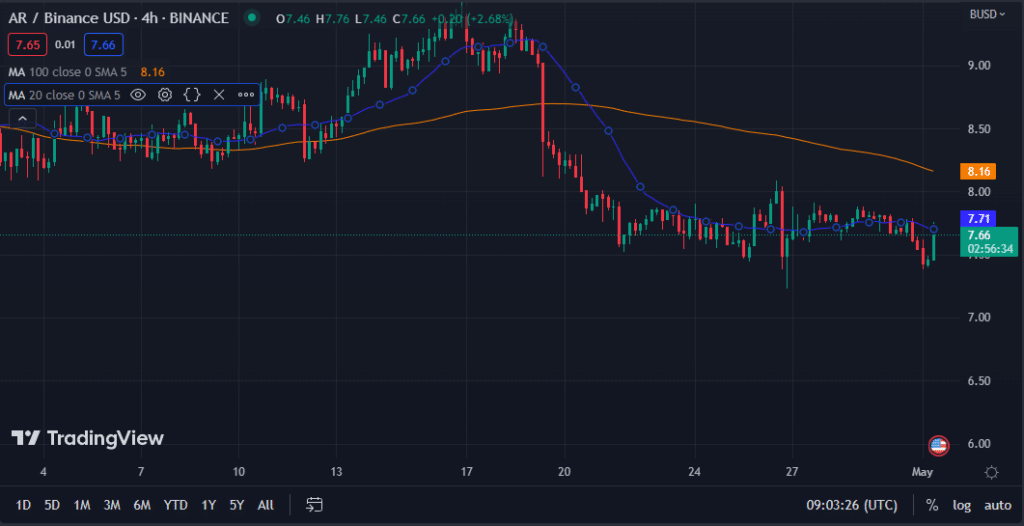
ARB/USD chart (source: TradingView)
Conclusion
To summarize, the ARB market is presently displaying a minor bearish trend; however, several indicators suggest a potential shift toward bullish sentiment, indicating that traders could consider purchasing now to benefit from future profits.


